Multi-indicator Signal Builder [Skyrexio]Overview
Multi-Indicator Signal Builder is a versatile, all-in-one script designed to streamline your trading workflow by combining multiple popular technical indicators under a single roof. It features a single-entry, single-exit logic, intrabar stop-loss/take-profit handling, an optional time filter, a visually accessible condition table, and a built-in statistics label. Traders can choose any combination of 12+ indicators (RSI, Ultimate Oscillator, Bollinger %B, Moving Averages, ADX, Stochastic, MACD, PSAR, MFI, CCI, Heikin Ashi, and a “TV Screener” placeholder) to form entry or exit conditions. This script aims to simplify strategy creation and analysis, making it a powerful toolkit for technical traders.
Indicators Overview
1. RSI (Relative Strength Index)
Measures recent price changes to evaluate overbought or oversold conditions on a 0–100 scale.
2. Ultimate Oscillator (UO)
Uses weighted averages of three different timeframes, aiming to confirm price momentum while avoiding false divergences.
3. Bollinger %B
Expresses price relative to Bollinger Bands, indicating whether price is near the upper band (overbought) or lower band (oversold).
4. Moving Average (MA)
Smooths price data over a specified period. The script supports both SMA and EMA to help identify trend direction and potential crossovers.
5. ADX (Average Directional Index)
Gauges the strength of a trend (0–100). Higher ADX signals stronger momentum, while lower ADX indicates a weaker trend.
6. Stochastic
Compares a closing price to a price range over a given period to identify momentum shifts and potential reversals.
7. MACD (Moving Average Convergence/Divergence)
Tracks the difference between two EMAs plus a signal line, commonly used to spot momentum flips through crossovers.
8. PSAR (Parabolic SAR)
Plots a trailing stop-and-reverse dot that moves with the trend. Often used to signal potential reversals when price crosses PSAR.
9. MFI (Money Flow Index)
Similar to RSI but incorporates volume data. A reading above 80 can suggest overbought conditions, while below 20 may indicate oversold.
10. CCI (Commodity Channel Index)
Identifies cyclical trends or overbought/oversold levels by comparing current price to an average price over a set timeframe.
11. Heikin Ashi
A type of candlestick charting that filters out market noise. The script uses a streak-based approach (multiple consecutive bullish or bearish bars) to gauge mini-trends.
12. TV Screener
A placeholder condition designed to integrate external buy/sell logic (like a TradingView “Buy” or “Sell” rating). Users can override or reference external signals if desired.
Unique Features
1. Multi-Indicator Entry and Exit
You can selectively enable any subset of 12+ classic indicators, each with customizable parameters and conditions. A position opens only if all enabled entry conditions are met, and it closes only when all enabled exit conditions are satisfied, helping reduce false triggers.
2. Single-Entry / Single-Exit with Intrabar SL/TP
The script supports a single position at a time. Once a position is open, it monitors intrabar to see if the price hits your stop-loss or take-profit levels before the bar closes, making results more realistic for fast-moving markets.
3. Time Window Filter
Users may specify a start/end date range during which trades are allowed, making it convenient to focus on specific market cycles for backtesting or live trading.
4. Condition Table and Statistics
A table at the bottom of the chart lists all active entry/exit indicators. Upon each closed trade, an integrated statistics label displays net profit, total trades, win/loss count, average and median PnL, etc.
5. Seamless Alerts and Automation
Configure alerts in TradingView using “Any alert() function call.”
The script sends JSON alert messages you can route to your own webhook.
The indicator can be integrated with Skyrexio alert bots to automate execution on major cryptocurrency exchanges
6. Optional MA/PSAR Plots
For added visual clarity, optionally plot the chosen moving averages or PSAR on the chart to confirm signals without stacking multiple indicators.
Methodology
1. Multi-Indicator Entry Logic
When multiple entry indicators are enabled (e.g., RSI + Stochastic + MACD), the script requires all signals to align before generating an entry. Each indicator can be set for crossovers, crossunders, thresholds (above/below), etc. This “AND” logic aims to filter out low-confidence triggers.
2. Single-Entry Intrabar SL/TP
One Position At a Time: Once an entry signal triggers, a trade opens at the bar’s close.
Intrabar Checks: Stop-loss and take-profit levels (if enabled) are monitored on every tick. If either is reached, the position closes immediately, without waiting for the bar to end.
3. Exit Logic
All Conditions Must Agree: If the trade is still open (SL/TP not triggered), then all enabled exit indicators must confirm a closure before the script exits on the bar’s close.
4. Time Filter
Optional Trading Window: You can activate a date/time range to constrain entries and exits strictly to that interval.
Justification of Methodology
Indicator Confluence: Combining multiple tools (RSI, MACD, etc.) can reduce noise and false signals.
Intrabar SL/TP: Capturing real-time spikes or dips provides a more precise reflection of typical live trading scenarios.
Single-Entry Model: Straightforward for both manual and automated tracking (especially important in bridging to bots).
Custom Date Range: Helps refine backtesting for specific market conditions or to avoid known irregular data periods.
How to Use
1. Add the Script to Your Chart
In TradingView, open Indicators , search for “Multi-indicator Signal Builder”.
Click to add it to your chart.
2. Configure Inputs
Time Filter: Set a start and end date for trades.
Alerts Messages: Input any JSON or text payload needed by your external service or bot.
Entry Conditions: Enable and configure any indicators (e.g., RSI, MACD) for a confluence-based entry.
Close Conditions: Enable exit indicators, along with optional SL (negative %) and TP (positive %) levels.
3. Set Up Alerts
In TradingView, select “Create Alert” → Condition = “Any alert() function call” → choose this script.
Entry Alert: Triggers on the script’s entry signal.
Close Alert: Triggers on the script’s close signal (or if SL/TP is hit).
Skyrexio Alert Bots: You can route these alerts via webhook to Skyrexio alert bots to automate order execution on major crypto exchanges (or any other supported broker).
4. Visual Reference
A condition table at the bottom summarizes active signals.
Statistics Label updates automatically as trades are closed, showing PnL stats and distribution metrics.
Backtesting Guidelines
Symbol/Timeframe: Works on multiple assets and timeframes; always do thorough testing.
Realistic Costs: Adjust commissions and potential slippage to match typical exchange conditions.
Risk Management: If using the built-in stop-loss/take-profit, set percentages that reflect your personal risk tolerance.
Longer Test Horizons: Verify performance across diverse market cycles to gauge reliability.
Example of statistic calculation
Test Period: 2023-01-01 to 2025-12-31
Initial Capital: $1,000
Commission: 0.1%, Slippage ~5 ticks
Trade Count: 468 (varies by strategy conditions)
Win rate: 76% (varies by strategy conditions)
Net Profit: +96.17% (varies by strategy conditions)
Disclaimer
This indicator is provided strictly for informational and educational purposes .
It does not constitute financial or trading advice.
Past performance never guarantees future results.
Always test thoroughly in demo environments before using real capital.
Enjoy exploring the Multi-Indicator Signal Builder! Experiment with different indicator combinations and adjust parameters to align with your trading preferences, whether you trade manually or link your alerts to external automation services. Happy trading and stay safe!
在脚本中搜索"take profit"

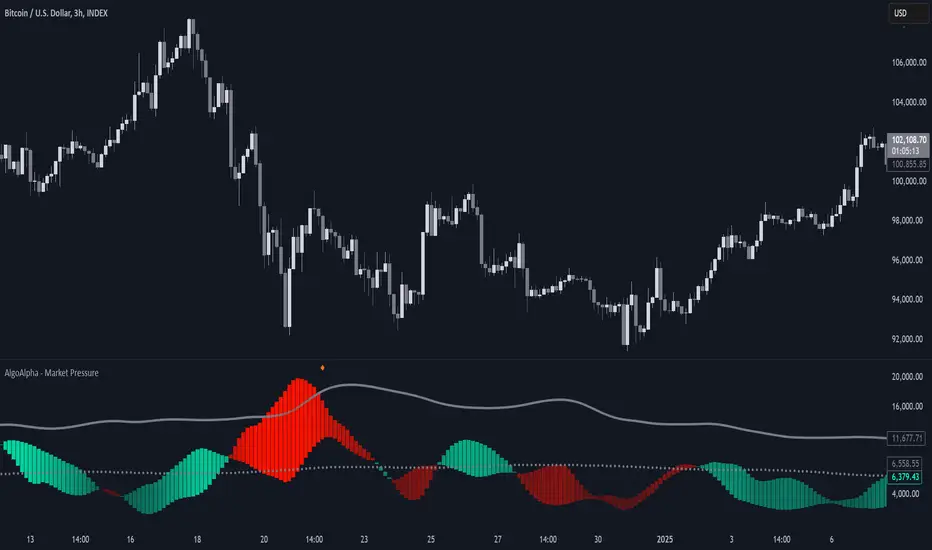
Market Pressure Index [AlgoAlpha]The Market Pressure Index is a cutting-edge trading tool designed to measure and visualize bullish and bearish momentum through a unique blend of volatility analysis and dynamic smoothing techniques. This indicator provides traders with an intuitive understanding of market pressure, making it easier to identify trend shifts, breakout opportunities, and key moments to take profit. Perfect for scalpers and swing traders looking for a strategic edge in volatile markets.
Key Features:
🔎 Bullish and Bearish Volatility Separation : Dynamically calculates and displays bullish and bearish momentum separately, helping traders assess market direction with precision.
🎨 Customizable Appearance: Set your preferred colors for bullish and bearish signals to match your chart's theme.
📊 Deviation-Based Upper Band : Tracks extreme volatility levels using a configurable deviation multiplier, highlighting potential breakout points.
📈 Real-Time Signal Alerts : Provides alerts for bullish and bearish crossovers, as well as take-profit signals, ensuring you never miss key market movements.
⚡ Gradient-Based Visualization : Uses color gradients to depict the intensity of market pressure, making it easy to spot changes in momentum at a glance.
How to Use:
Add the Indicator : Add the Market Pressure Index to your TradingView chart by clicking the star icon. Customize inputs like the pressure lookback period, deviation settings, and colors to fit your trading style.
Interpret the Signals : Monitor the bullish and bearish momentum columns to gauge market direction. Look for crossovers to signal potential trend changes.
Take Action : Use alerts for breakouts above the upper band or for take-profit levels to enhance your trade execution.
How It Works:
The Market Pressure Index separates bullish and bearish momentum by analyzing price movement (close vs. open) and volatility. These values are smoothed using Hull Moving Averages (HMA) to highlight trends while minimizing noise. A deviation-based upper band dynamically tracks market extremes, signaling breakout zones. Color gradients depict the intensity of momentum, offering a clear, visually intuitive representation of market pressure. Alerts are triggered when significant crossovers or take-profit conditions occur, giving traders actionable insights without constant chart monitoring.
Price Action + Support/Resistance with LabelsEntry Conditions:
Long Entry (BUY): Based on the bullish engulfing pattern and price being above the resistance level.
Short Entry (SELL): For demonstration, the short entry condition is set as price being below the support level and a bullish candle in the previous bar. You can modify this logic for your own use case.
Stop Loss and Take Profit:
Stoploss is plotted at the calculated stop loss level.
Target is plotted at the calculated take profit level.
Labels:
For long trades, labels are added with "BUY", "STOPLOSS", and "TARGET".
For short trades (if enabled), labels are added with "SELL", "STOPLOSS", and "TARGET".
Labels are placed using label.new at specific locations on the chart (above or below bars).
Alert Conditions:
Alerts are created for both long and short entry signals so you can get notified when the entry conditions are met.
How it works:
BUY label will appear below the bar when a long entry condition is met.
SELL label will appear above the bar when a short entry condition is met.
STOPLOSS and TARGET labels will appear at their respective levels when an entry signal is triggered.
The labels will appear on the chart to give you a clear visual cue of the entry, stop loss, and take profit levels.
How to Use:
Copy the script into your Pine Editor on TradingView and apply it to your chart.
Observe the labels that show up on the chart:
"BUY" will appear below the bar when long conditions are met.
"SELL" will appear above the bar when short conditions are met (if using short logic).
"STOPLOSS" will be plotted at the stop loss level.
"TARGET" will be plotted at the take profit level.
Optional Customization:
You can modify the short entry condition based on your preferred method.
You can adjust the length for the support/resistance calculation, the stopLossRR, and other parameters to fine-tune the strategy for Nifty 50 or any other asset.
Let me know if you have any further questions or need additional modifications!

Fibonacci Extension Strt StrategyCore Logic and Steps:
Weekly Trend Identification:
Find the last significant Higher High (HH) and Lower Low (LL) or vice-versa on the Weekly timeframe.
Determine if it's an uptrend (HH followed by LL) or a downtrend (LL followed by HH).
Plot a Fibonacci Extension (or Retracement in reverse order) from the swing point determined to the other significant swing point.
Weekly Retracement Levels:
Display horizontal lines at the 0.236, 0.382, and 0.5 Fibonacci levels from the weekly extension.
Monitor price action on these levels.
Daily Confirmation:
When price hits the Fib levels, examine the Daily chart.
Look for a rejection wick (indicating the pull back is ending) on the identified weekly retracement levels.
Confirm that the price is indeed starting to continue in the direction of the original weekly trend.
Four-Hour Entry:
On the 4H timeframe, plot a new Fib Extension in the opposite direction of the weekly.
If it's an uptrend, the Fib is plotted from last swing low to its swing high. If the weekly trend was bearish the Fib will be plotted from last swing high to the swing low.
Generate an entry when price breaks the high of that candle.
Trade Management:
Entry is on the breakout of the current candle.
Stop Loss: Place the stop loss below the wick of the breakout candle.
Take Profit 1: Close 50% of the position at the 0.5 Fibonacci level. Move the stop loss to breakeven on this position.
Take Profit 2: Close another 25% of the position at the 0.236 Fib level.
Trailing Take Profit: Keep the last 25% open, using a trailing stop loss. (You'll need to define the logic for the trailing stop, e.g., trailing stop using the last high/low)
How to Use in TradingView:
Open a TradingView Chart.
Click on "Pine Editor" at the bottom.
Copy and paste the corrected Pine Script code.
Click "Add to Chart".
The indicator should now be displayed on your chart.

[KaraTread] Supply & DemandThe " Supply & Demand Indicator" is designed to analyze market supply and demand zones, identify key levels such as swing points (local highs and lows), and plot Fibonacci levels. Its primary goal is to detect potential entry points, set stop-losses, and determine take-profit targets based on market structure analysis.
Key Features:
1. Swing Points Analysis:
Automatically identifies local highs (Swing Highs) and lows (Swing Lows) on the chart.
Displays these points as circles on the chart, making it easier for traders to visualize market structure.
2. Fibonacci Levels:
Calculates key Fibonacci levels based on the current market structure.
Displays these levels on the chart with different line styles for better visual clarity.
Allows customization of coefficients for entry points, stop-losses, and take-profits.
3. Supply and Demand Zones:
Automatically draws rectangular zones illustrating areas of significant market activity (green for demand zones, red for supply zones).
These zones help identify potential reversal or continuation areas in the market.
4. Trend Reversal Detection (CHoCH and BOS):
Identifies key moments of trend changes (Change of Character, CHoCH) and structure breaks (Break of Structure, BOS).
Helps traders spot when the market is likely to change direction.
5. Live Levels Display:
The indicator creates live levels that update in real-time, showing the current zones and key levels.
Settings:
Structure Settings:
Show Swing Points: Enable/disable the display of swing points.
Structure Length: Sets the length of the structure for analysis.
Fibonacci Levels Settings:
Entry point coefficient: Coefficient for calculating the entry point.
Stop loss coefficient: Coefficient for calculating the stop-loss level.
Take profit coefficient: Coefficient for calculating the take-profit level.
Usage:
This indicator is a powerful tool for identifying market zones and is suitable for both manual and automated trading strategies. By combining swing point analysis, supply/demand zones, and Fibonacci levels, it provides traders with a visual representation of the current market situation, enabling more informed decision-making.
The indicator is ideal for all types of traders, especially those who rely on price action and wish to incorporate Fibonacci levels into their strategies.

Crodl Position Size CalculatorThe Crodl Size Position Calculator is a powerful and intuitive tool designed for traders to calculate their position size, risk, and reward before entering a trade. This indicator simplifies trade planning by providing clear calculations of key metrics such as risk-to-reward ratio, position size, expected profit, and current PnL (Profit and Loss).
Features:
Dynamic Input Fields: Customize your trade parameters, including risk loss, leverage, entry price, stop loss, and take profit.
Position Size Calculation: Automatically calculate the number of units to trade based on your risk tolerance and leverage.
Risk/Reward Ratio: See the ratio of potential profit to risk for informed decision-making.
Real-Time PnL Tracking: Monitor your current profit or loss directly on the chart.
Expected Profit Projection: Displays the profit potential based on your risk-to-reward ratio.
Position Plotting: Visualize your entry, stop loss, and take profit levels directly on the chart with color-coded lines and zones.
User-Friendly Table: A detailed table provides clear visibility of all trade metrics, including:
Risk Loss
Leverage
Entry Price
Stop Loss
Take Profit
Risk/Reward Ratio
Bet Amount
Crypto Units
Real-Time PnL
Expected Profit
How It Works:
Set Your Parameters: Input your desired risk loss, leverage, entry price, stop loss, and take profit levels in the settings.
Get Instant Results: The indicator calculates position size, PnL, expected profit, and other key metrics.
Visualize on the Chart: See your entry, stop loss, and take profit levels plotted on the chart for clarity.
Review the Trade Table: A table at the bottom-right of the screen summarizes all calculations and updates dynamically as the market price changes.
Who is it for? This indicator is ideal for traders of all experience levels, whether you're a beginner learning risk management or a professional looking for efficient trade planning tools.
Customization Options:
Adjust the size of the plotted position zones.
Enable or disable zone plotting for a cleaner chart.
Tailor inputs to match your trading strategy.
Note: Always use proper risk management and ensure your trading parameters align with your personal trading goals and strategy. Use at Own Risk

Net Unrealized Profit Loss | JeffreyTimmermansNet Unrealized Profit Loss (NUPL)
The "Net Unrealized Profit Loss" (NUPL) indicator is a highly regarded tool for assessing Bitcoin investor sentiment by analyzing the relationship between Market Value and Realized Value. This Pine Script implementation, developed by Jeffrey Timmermans, includes additional features such as dynamic labels, alerts, and thresholds with color-coded bands, enhancing its usability for traders and analysts.
Core Concepts Behind NUPL
Market Value (MV):
Defined as the current Bitcoin price multiplied by the number of coins in circulation.
Equivalent to market capitalization in traditional finance.
Realized Value (RV):
Calculated by considering the price at which each Bitcoin last moved (e.g., transferred between wallets).
The average price of all these transactions is multiplied by the total coins in circulation.
Net Unrealized Profit Loss (NUPL):
Formula: NUPL = (Market Value − Realized Value) : Market Value × 100
Measures the proportion of paper profits or losses held by investors relative to the market cap.
Significance of NUPL:
Tracks investor sentiment over time.
A high NUPL value indicates that most investors are in profit, often signaling potential market overheating.
A low or negative NUPL suggests pessimism and undervaluation, which may precede market recovery.
How to View the Chart
The NUPL chart uses distinct percentage bands to delineate various market phases. These bands provide context for understanding investor sentiment and market stages:
Extreme Low Values (< 0%): Indicates widespread losses; the market may be near capitulation.
Neutral Value (0%): A balance between profit and loss; often signifies a transition phase.
Slightly High to High Values (> 0% to 50%): Increasing profits suggest growing optimism; early stages of bullish trends.
Extreme High Values (> 75%): Signals overheating; often corresponds to excessive greed, which may precede corrections.
The colored bands visually represent these stages, enabling traders to identify key turning points.
Features of the Script
Querying Data
The indicator uses data from two key sources:
Bitcoin Market Cap (MC1): GLASSNODE:BTC_MARKETCAP
Bitcoin Realized Cap (MCR): COINMETRICS:BTC_MARKETCAPREAL
These values are fetched using the request.security function to ensure daily accuracy, regardless of the chart's timeframe.
Threshold Calculation
The script computes NUPL values dynamically and compares them against historical lows:
Calculated using the ta.lowest function over a 1,000-bar lookback period.
The average of the historical low and the current NUPL value, providing a dynamic baseline.
Value Classification
NUPL is categorized into sentiment levels with corresponding weights:
< Low Threshold: 1 (Extreme Bearish)
Low to 0: 0.75 (Moderate Bearish)
0 to 25: 0.25 (Neutral to Slightly Bullish)
25 to 50: -0.25 (Moderate Bullish)
50 to 75 : -0.75 (Strong Bullish)
> 75: -1 (Extreme Bullish)
Visual Elements
NUPL Line Plot:
The NUPL line is plotted in orange for clear visibility.
Threshold Bands:
Horizontal thresholds ranging from -160 to 160 and are plotted, representing key sentiment levels. Bands are categorized as:
Extreme High/Low Values
Significant High/Low Values
Neutral Values
Fill Colors:
Red Shades (Bearish Sentiment): Above neutral levels.
Green Shades (Bullish Sentiment): Below neutral levels.
The opacity of fills decreases as sentiment moves from extreme to neutral values.
Dynamic Label:
A real-time label displays the current NUPL value and sentiment classification.
Positioned directly on the NUPL line for immediate insight.
Alerts:
The indicator includes two alerts for crossing key thresholds:
NUPL Above 0% Alert: Triggers when NUPL crosses above the neutral value, signaling a shift to positive sentiment.
NUPL Below 0% Alert: Triggers when NUPL crosses below the neutral value, indicating a shift to negative sentiment.
Alerts are configured with alert.freq_once_per_bar to avoid redundancy during intra-bar fluctuations.
Use Cases
Identifying Market Extremes:
Use NUPL levels to pinpoint moments of extreme greed or fear, which often precede market reversals.
Long-Term Strategy:
NUPL trends can assist strategic investors in deciding when to accumulate during pessimistic phases or take profits during euphoria.
Market Sentiment Analysis:
Provides a macro perspective on the prevailing investor sentiment, offering valuable context for trading decisions.
Conclusion
The Net Unrealized Profit Loss (NUPL) indicator combines advanced data processing with intuitive visualization to deliver actionable insights into Bitcoin market sentiment. With its real-time alerts, dynamic labels, and comprehensive banding system, this tool is indispensable for traders and investors seeking to understand and anticipate market movements based on sentiment analysis.
-Jeffrey

Dragon Harmonic Pattern [TradingFinder] Dragon Detector🔵 Introduction
The Dragon Harmonic Pattern is one of the technical analysis tools that assists traders in identifying Potential Reversal Zones (PRZ). Resembling an "M" or "W" shape, this pattern is recognized in financial markets as a method for predicting bullish and bearish trends. By leveraging precise Fibonacci ratios and measuring price movements, traders can use this pattern to forecast market trends with high accuracy.
The Dragon Harmonic Pattern is built on the XABCD structure, where each point plays a significant role in shaping and forecasting price movements. Point X marks the beginning of the trend, representing the initial price movement. Point A indicates the first retracement, usually falling within the 0.380 to 0.620 range of the XA wave.
Next, point B signals the second retracement, which lies within 0.200 to 0.400 of the AB wave. Point C, acting as the hump of the pattern, is generally located within 0.800 to 1.100 of the XA wave. Finally, point D represents the endpoint of the pattern and the Potential Reversal Zone (PRZ), where the primary price reversal occurs.
In bullish scenarios, the Dragon Pattern indicates a reversal from a downtrend to an uptrend, where prices move upward from point D. Conversely, in bearish scenarios, prices decline after reaching point D. Accurate identification of this pattern through Fibonacci ratio analysis and PRZ examination can significantly increase the success rate of trades, enabling traders to adjust their strategies based on key market levels such as 0.618 or 1.100.
Due to its high accuracy in identifying Potential Reversal Zones (PRZ) and its alignment with Fibonacci ratios, the Dragon Harmonic Pattern is considered one of the most popular tools in technical analysis. Traders can use this pattern to pinpoint entry and exit points with greater confidence while minimizing trading risks.
Bullish :
Bearish :
🔵 How to Use
The Dragon Harmonic Pattern indicator helps traders identify bullish and bearish patterns in the market, allowing them to capitalize on available trading opportunities. By analyzing Fibonacci ratios and the XABCD structure, the indicator highlights Potential Reversal Zones (PRZ).
🟣 Bullish Dragon Pattern
In the Bullish Dragon Pattern, the price transitions from a downtrend to an uptrend after reaching point D. At this stage, points X, A, B, C, and D must be carefully identified.
Fibonacci ratios for these points are as follows: Point A should fall within 0.380 to 0.620 of the XA wave, point B within 0.200 to 0.400 of the AB wave, and point C within 0.800 to 1.100 of the XA wave.
When the price reaches point D, traders should look for bullish signals such as reversal candlesticks or increased trading volume to enter a buy position. The take-profit level can be set near the previous price high or based on the 1.272 Fibonacci ratio of the XA wave, while the stop-loss should be placed slightly below point D.
🟣 Bearish Dragon Pattern
In the Bearish Dragon Pattern, the price shifts from an uptrend to a downtrend after reaching point D. In this pattern, points X, A, B, C, and D must also be identified. Fibonacci ratios for these points are as follows: Point A should fall within 0.380 to 0.620 of the XA wave, point B within 0.200 to 0.400 of the AB wave, and point C within 0.800 to 1.100 of the XA wave.
Upon reaching point D, bearish signals such as reversal candlesticks or decreasing trading volume indicate the opportunity to enter a sell position. The take-profit level can be set near the previous price low or based on the 1.272 Fibonacci ratio of the XA wave, while the stop-loss should be placed slightly above point D.
By combining the Dragon Harmonic Pattern indicator with precise Fibonacci ratio analysis, traders can identify key opportunities while minimizing risks and improving their decision-making in both bullish and bearish market conditions.
🔵 Setting
🟣 Logical Setting
ZigZag Pivot Period : You can adjust the period so that the harmonic patterns are adjusted according to the pivot period you want. This factor is the most important parameter in pattern recognition.
Show Valid Forma t: If this parameter is on "On" mode, only patterns will be displayed that they have exact format and no noise can be seen in them. If "Off" is, the patterns displayed that maybe are noisy and do not exactly correspond to the original pattern.
Show Formation Last Pivot Confirm : if Turned on, you can see this ability of patterns when their last pivot is formed. If this feature is off, it will see the patterns as soon as they are formed. The advantage of this option being clear is less formation of fielded patterns, and it is accompanied by the latest pattern seeing and a sharp reduction in reward to risk.
Period of Formation Last Pivot : Using this parameter you can determine that the last pivot is based on Pivot period.
🟣 Genaral Setting
Show : Enter "On" to display the template and "Off" to not display the template.
Color : Enter the desired color to draw the pattern in this parameter.
LineWidth : You can enter the number 1 or numbers higher than one to adjust the thickness of the drawing lines. This number must be an integer and increases with increasing thickness.
LabelSize : You can adjust the size of the labels by using the "size.auto", "size.tiny", "size.smal", "size.normal", "size.large" or "size.huge" entries.
🟣 Alert Setting
Alert : On / Off
Message Frequency : This string parameter defines the announcement frequency. Choices include: "All" (activates the alert every time the function is called), "Once Per Bar" (activates the alert only on the first call within the bar), and "Once Per Bar Close" (the alert is activated only by a call at the last script execution of the real-time bar upon closing). The default setting is "Once per Bar".
Show Alert Time by Time Zone : The date, hour, and minute you receive in alert messages can be based on any time zone you choose. For example, if you want New York time, you should enter "UTC-4". This input is set to the time zone "UTC" by default.
🔵 Conclusion
The Dragon Harmonic Pattern is an advanced and practical technical analysis tool that aids traders in accurately predicting bullish and bearish trends by identifying Potential Reversal Zones (PRZ) and utilizing Fibonacci ratios. Built on the XABCD structure, this pattern stands out for its flexibility and precision in identifying price movements, making it a valuable resource among technical analysts. One of its key advantages is its compatibility with other technical tools such as trendlines, support and resistance levels, and Fibonacci retracements.
By using the Dragon Harmonic Pattern indicator, traders can accurately determine entry and exit points for their trades. The indicator analyzes key Fibonacci ratios—0.380 to 0.620, 0.200 to 0.400, and 0.800 to 1.100—to identify critical levels such as price highs and lows, offering precise trading strategies. In bullish scenarios, traders can profit from rising prices, while in bearish scenarios, they can capitalize on price declines.
In conclusion, the Dragon Harmonic Pattern is a highly reliable tool for identifying trading opportunities with exceptional accuracy. However, for optimal results, it is recommended to combine this pattern with other analytical tools and thoroughly assess market conditions. By utilizing this indicator, traders can reduce their trading risks while achieving higher profitability and confidence in their trading strategies.

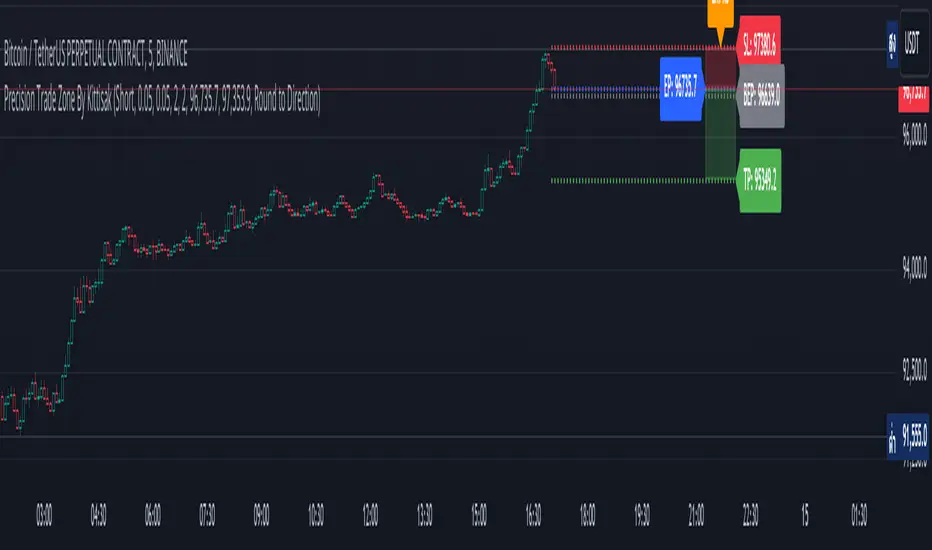
Precision Trade Zone By KittisakThis indicator is designed for Money Management calculations, helping to facilitate risk management in trading, determining suitable leverage based on acceptable risk, and adjusting the Stop Loss level to align with the calculated leverage.
Abbreviation Descriptions
LR : Suitable Leverage.
EP : Entry Price.
BEP : Break-Even Point (a point where you can move your Stop Loss to prevent losses once the price reaches a certain level).
SL : Stop Loss (a recalculated Stop Loss level to match the leverage. You should use this as the Stop Loss price instead of the initial level you set).
TP : Take Profit (a point where you take profit based on the defined risk-reward ratio).
Note
When first activating the indicator, an error may occur, and no output will be displayed. This happens because you must first specify the Entry Price and Stop Loss in the indicator settings.
How Much Leverage Should You Use?
It may seem like a simple question but is difficult to answer.
Method for Calculating Suitable Leverage
Use the formula:
Leverage = Acceptable Loss / (Distance between Entry Price and Stop Loss + (Buy Fee + Sell Fee))
Calculating the Correct Stop Loss Point
(Stop Loss levels will be slightly adjusted or extended)
For Long Positions :
New Stop Loss = Entry Price * (1 - Acceptable Loss / (Calculated Leverage * 100))
For Short Positions :
New Stop Loss = Entry Price * (1 + Acceptable Loss / (Calculated Leverage * 100))
Calculating the Correct Take Profit Point
(Take Profit levels will be slightly adjusted or extended)
For Long Positions :
Take Profit = Entry Price * (1 + (Acceptable Loss / (Calculated Leverage * 100) * RR) + ((Buy Fee + Sell Fee) / 100))
For Short Positions :
Take Profit = Entry Price * (1 - (Acceptable Loss / (Calculated Leverage * 100) * RR) + ((Buy Fee + Sell Fee) / 100))
Benefits of This Calculation
1. Accurate Risk Assessment
The calculated leverage accounts for trading fees. For example, if you aim for a 2% loss, this method ensures the actual loss is exactly 2%, not more (e.g., 2% plus fees).
2. Eliminates Guesswork
Randomly setting leverage can lead to risks because the Stop Loss level may not align with your position. This calculation ensures that the leverage aligns precisely with your desired Stop Loss level.
3. Realistic Profit Targets
For example, with a 2% acceptable loss and a 1:2 RR, you expect a 4% profit. However, without this calculation, fees may reduce your profit below 4%. This method includes fees, ensuring your profit matches the intended target.
Caution
This indicator does not account for slippage or requotes. Use it with caution and allow a buffer for slippage in your calculations.
Indicator นี้มีไว้สำหรับคำนวณ Money Management ซึ่งจะช่วยอำนวยความสะดวกในการจัดการความเสี่ยงในการเทรด การคำนวณ Leverage ที่เหมาะสมกับความเสี่ยงที่คุณยอมรับได้ และจัดการจุด Stop Loss ให้เหมาะสมกับ Leverage นั้น
คำอธิบายเกี่ยวกับคำย่อ
LR หมายถึง Leverage ที่เหมาะสม
EP หมายถึง Entry Price หรือราคาเข้าซื้อ
BEP หมายถึง Break-Even Point หรือจุดคุ้มทุน (คุณสามารถย้าย Stop Loss มาที่จุดนี้เมื่อราคาไปถึงจุดหนึ่งเพื่อป้องกันการขาดทุนได้)
SL หมายถึง Stop Loss (ซึ่งเป็น Stop Loss ที่คำนวณใหม่เพื่อให้ตำแหน่งเหมาะสมกับ Leverage ที่คำนวณได้ คุณควรใช้จุดนี้เพื่อเป็นราคา Stop Loss แทนจุด Stop Loss ที่คุณกำหนดไว้ในตอนแรก)
TP หมายถึง Take Profit (เป็นจุดที่คุณจะขายทำกำไรตาม RR ที่กำหนดไว้)
* หมายเหตุ เมื่อเริ่มเปิด Indicator จะเกิด Error ขึ้น และไม่มีผลลัพท์ใด ๆ แสดงให้เห็น นั่นเป็นเพราะคุณต้องเข้าไปกำหนด Entry Price และ Stop Loss ในการตั้งค่าของ Indicator เสียก่อน
ต้องใช้ Leverage เท่าไหร่? มันเป็นคำถามที่ดูเหมือนง่าย แต่ตอบยาก
วิธีคำนวณ Leverage ที่เหมาะสม ใช้สมการคือ
Levarage = การขาดทุนที่ยอมรับได้ / (ระยะห่างระหว่าง Entry Price และ Stop Loss + (ค่าธรรมเนียมซื้อ + ค่าธรรมเนียมขาย))
นำผลลัพท์ Leverage ที่ได้มาคำนวณเพื่อหาจุด Stop Loss ที่ถูกต้อง (จุดของ Stop Loss จะมีการยืดขยายออกไปเล็กน้อย) โดยใช้สมการ
ตำแหน่ง Stop Loss ใหม่ = Entry Price * (1 - การขาดทุนที่ยอมรับได้ / (Leverage ที่คำนวณได้ * 100)) // สำหรับ Long
ตำแหน่ง Stop Loss ใหม่ = Entry Price * (1 + การขาดทุนที่ยอมรับได้ / (Leverage ที่คำนวณได้ * 100)) // สำหรับ Short
นำผลลัพท์ Leverage ที่ได้มาคำนวณเพื่อหาจุด Take Profit ที่ถูกต้อง (จุดของ Take Profit จะมีการยืดขยายออกไปเล็กน้อย) โดยใช้สมการ
ตำแหน่ง Take Profit = Entry Price * (1 + (การขาดทุนที่ยอมรับได้ / (Leverage ที่คำนวณได้ * 100) * RR) + ((ค่าธรรมเนียมซื้อ + ค่าธรรมเนียมขาย) / 100)) // สำหรับ Long
ตำแหน่ง Take Profit = Entry Price * (1 - (การขาดทุนที่ยอมรับได้ / (Leverage ที่คำนวณได้ * 100) * RR) + ((ค่าธรรมเนียมซื้อ + ค่าธรรมเนียมขาย) / 100)) // สำหรับ Short
ข้อดีของการคำนวณคือ
1. คุณจะได้ค่า Leverage ที่เหมาะสมกับความเสี่ยงที่คุณยอมรับได้โดยรวมค่าธรรมเนียมเข้าไปในนั้นแล้ว นั่นหมายความว่า ความสูญเสียจะเป็น 2% (ตามตัวอย่าง) จริง ๆ ไม่ใช่ 2% และถูกหักค่าธรรมเนียมเพิ่มอีก กลายเป็นสูญเสียมากกว่า 2%
2. การตั้ง Leverage มั่ว ๆ กลายเป็นความเสี่ยง นั่นเพราะตำแหน่งของ Stop Loss ไม่ได้อยู่ในจุดที่ควรจะเป็น การคำนวณนี้ช่วยให้คุณได้ Leverage ในตำแหน่ง Stop Loss ที่คุณต้องการโดยแท้จริง
3. ผลกำไรที่ได้รับตรงกับความต้องการจริง ๆ เช่น การขาดทุนที่ยอมรับได้ 2% และ RR 1:2 สิ่งที่คุณคิดคือกำไร 4% แต่จริง ๆ แล้วไม่ถึง 4% นั่นเพราะว่าโดนหักค่าธรรมเนียมไปส่วนหนึ่ง การคำนวณนี้ได้รวมค่าธรรมเนียมให้แล้ว คุณจึงได้กำไรที่ 4% อย่างถูกต้องตามต้องการ
ข้อควรระวัง
Indicator นี้ไม่ได้มีการควบคุมความเสี่ยงในเรื่องของ slippage หรือ requote โปรดใช้งานอย่างระมัดระวังและมีการเผื่อระยะสำหรับ slippage ด้วย
Project R
Project R : Advanced Trading Strategy with Dynamic Entry Signals
Overview
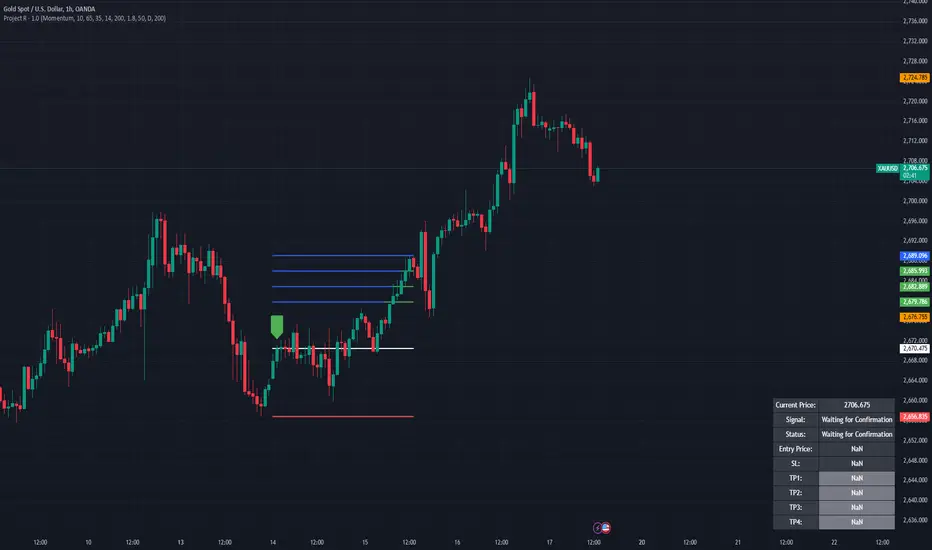
Project R is a comprehensive trading script tailored for traders seeking accuracy in market entries and exits. It merges multiple technical indicators—CCI, Momentum, RSI, and Mean Reversion Bands—with advanced trading tools like supply and demand zone detection, ATR-based stop-loss levels, and tiered take-profit targets. The script is designed to cater to both trend-following and mean-reversion strategies, offering dynamic adaptability to various market conditions. Its robust functionality and user-focused customization make it an invaluable tool for traders aiming to optimize their performance in live markets.
---
🔶 Key Features
1. Customizable Entry Signal Source
- Traders can select between CCI (Commodity Channel Index) and Momentum as the primary entry signal generator, depending on their preferred strategy.
- Additional confirmation through detection of regular bullish or bearish divergences within overbought and oversold zones of the RSI enhances signal reliability. This ensures the trader has an added layer of confidence in their decision-making.
2. Supply and Demand Area Tracking
- The script scans historical price action to detect critical supply and demand zones , areas where significant buying or selling interest has previously occurred.
- These zones are plotted on the chart to help traders anticipate reversals or breakouts, making it easier to identify high-probability entry and exit points.
3. Mean Reversion Bands
- EMA-based mean reversion bands provide clear visual guidance for traders employing mean-reversion strategies.
- The bands are calculated with adjustable multipliers, allowing traders to customize their sensitivity and identify optimal buy and sell zones within ranging markets.
4. ATR-Based Stop Loss and Take Profit Levels
- Dynamic risk management is achieved by calculating stop-loss levels and up to four take-profit targets using Average True Range (ATR) multipliers.
- This ensures that stop-loss and take-profit levels adjust automatically to market volatility, providing consistent risk-reward ratios tailored to prevailing conditions.
5. Higher Time Frame Confirmation
- The integration of a higher time frame EMA (Exponential Moving Average) filter ensures that trades are executed in alignment with broader market trends, increasing the probability of success.
- This feature is especially useful for traders who prioritize trend-following strategies and seek confirmation from larger time frames.
6. Status Tracking
- A dynamic status system displays the current state of the trade (e.g., "Waiting for Confirmation," "Enter Buy," or "Enter Sell") directly on the chart.
- The script also monitors and logs whether the stop loss or individual take-profit targets have been achieved, providing real-time updates for active trades.
---
🔹 Usage
How It Works
- Buy Signals : A buy signal is generated when the following conditions are met:
1. The chosen entry signal (CCI/Momentum) crosses upward, indicating bullish momentum.
2. RSI is in the oversold range or exhibits bullish divergence, signaling potential upward reversal.
3. Price is positioned above the higher time frame EMA and approaches identified demand zones, reinforcing a high-probability entry.
- Sell Signals: A sell signal is triggered when:
1. The chosen entry signal crosses downward, indicating bearish momentum.
2. RSI is in the overbought range or exhibits bearish divergence, suggesting potential downward reversal.
3. Price is positioned below the higher time frame EMA and approaches supply zones, aligning with bearish market sentiment.
- Stop Loss and Take Profit:
- Stop-loss levels are calculated dynamically based on ATR values, ensuring they adapt to market volatility.
- Multiple take-profit levels are provided to enable traders to scale out of positions incrementally, optimizing profit-taking strategies.
---
🔹 Practical Examples
- Mean Reversion Strategy: In ranging markets, traders can use the lower band as a buy zone and the upper band as a sell zone. For instance, when the price approaches the lower mean reversion band near a demand area, a buy signal is generated if other criteria are met.
- Trend Following Strategy: By aligning entries with the direction of the higher time frame EMA, traders can participate in long-term trends with greater confidence. For example, entering a buy trade when price crosses above the 50 EMA on a 1-hour chart ensures alignment with the dominant trend.
---
🔹 Visual Options
- Users can fully customize the color schemes, line styles, and visibility of key features, including:
- Mean reversion bands.
- Supply and demand zones.
- Take-profit and stop-loss levels.
- Entry points and trade progression are visually marked, ensuring traders can track real-time performance effortlessly.
---
🔶 Why Invite-Only?
Innovative Design
- Project R integrates advanced techniques, such as combining multiple indicators with supply and demand zone detection, to create a holistic and adaptable strategy.
- The use of ATR-based dynamic risk management and higher time frame confirmation offers traders a competitive edge in volatile markets.
Comprehensive Features
- The script provides a seamless trading experience by combining analysis, execution, and risk management in one tool.
- Its ability to cater to different trading styles (trend-following, mean-reversion, and divergence-based trading) ensures versatility and wide appeal.
Performance and Utility
- Real-time tracking, dynamic risk management, and precision in signal generation position Project R as a professional-grade tool that is suitable for traders of all levels.
- These features merit invite-only access to ensure the integrity of its use and provide exclusivity to dedicated traders who seek advanced functionality.
---
🔹 Settings
- Entry Signal Source: Choose between CCI and Momentum as the primary signal generator.
- RSI Levels: Adjust overbought and oversold thresholds to fine-tune divergence detection.
- ATR Multipliers: Customize stop-loss and take-profit levels based on your risk tolerance.
- Higher Time Frame EMA: Configure the higher time frame and EMA period to align with your preferred strategy.
- Supply/Demand Lookback Period: Modify the range for identifying supply and demand zones to suit market conditions.
- Mean Reversion Bands: Toggle the bands on or off and adjust their multipliers for a tailored mean-reversion strategy.
Smart Money Breakouts [iskess 01-02 11:05]This is an big update to the excellent Smart Money Breakout Script published in Oct 2023 by ChartPrime who, to my knowledge, was the original author.
FULL CREDIT GOES TO CHARTPRIME FOR THIS ORIGINAL WORK.
Per the moderator's rules, you will find below a meaningful, detailed self-contained description that does not rely on delegation to the open source code or links to other content. You will find in the description details on what the script does, how it does that, how to use it, and how it is original.
The "Smart Money Breakouts" indicator is designed to identify breakouts based on changes in character (CHOCH) or breaks of structure (BOS) patterns, facilitating automated trading with user-defined Take Profit (TP) level.
The indicator incorporates essential elements such as volume analysis and a data table to assist traders in optimizing their strategies.
🔸Breakout Detection:
The indicator scans price movements for "Change in Character" (CHOCH) and "Break of Structure" (BOS) patterns, signaling potential breakout opportunities in the market.
🔸User-Defined TP/SL :
Traders can customize the Take Profit (TP) and Stop Loss (SL) through the indicator settings, with these levels dynamically calculated based on the Average True Range (ATR). This allows for precise risk management and profit targets that adapt to market volatility. Traders can also select the lookback period for the TP/SL calculations.
🔸Volume Analysis and Trade Direction Specific Analysis:
The indicator includes a volume checker that provides valuable insights into the strength of the breakout, taking into account trade direction.
🔸If the volume label is red and the trade is long, it suggests a higher likelihood of hitting the Stop Loss (SL).
🔸If the volume label is green and the trade is long, it indicates a higher probability of hitting the Take Profit (TP).
🔸For short trades, a red volume label suggests a higher likelihood of hitting TP, while a green label suggests a higher likelihood of hitting SL.
🔸A yellow volume label suggests that the volume is inconclusive, neither favoring bullish nor bearish movements.
🔸Data Table:
The indicator features a data table that keeps track of the number of winning and losing trades for specific timeframes or configurations. It also shows the percentage of profits vs losses, and the overall profit/loss for the selected lookback period.
This table serves as a valuable tool for traders to analyze performance and discover optimal settings and timeframes.
The "Smart Money Breakouts" indicator provides traders with a comprehensive solution for breakout trading, combining technical analysis of changes in character and breaks of structure, volume insights, and performance tracking while dynamically adjusting TP and SL levels based on market volatility through the ATR.
This version of the script is a "significant improvement" from Chart Prime's original work in the following ways:
- A selectable range of candles for the profit/loss calculations to look back on.
- An updated table that includes the percentage of wins/losses, and and overall P&L during the selected lookback range.
- The user can now select only Long trades, Short trades, or both.
- The percentage gain/loss is now indicated for every trade on the chart.
- The user can now select a different multiplier for Stop Loss or Take Profit thresholds.

RISK MANAGEMENT TABLEThis updated Risk Management Indicator is a powerful and customizable tool designed to help traders effectively manage risk on every trade. By dynamically calculating position size, stop-loss, and take-profit levels, it enables traders to stay disciplined and follow predefined risk parameters directly on their charts.
Features:
Dynamic Stop-Loss and Take-Profit Levels:
Stop-loss is based on the Average True Range (ATR), offering a flexible way to account for
market volatility.
Take-profit levels can be customized as a percentage of the entry price, providing a clear
target for trade exits.
Position Sizing Calculation:
The indicator computes the maximum position size by considering:
Trade amount (montant_ligne).
Risk percentage per trade.
Transaction fees.
Visual Representation:
Displays stop-loss and take-profit levels on the chart as customizable lines.
Optional visibility of these lines through checkboxes in the settings panel.
Comprehensive Risk Table:
A table on the chart summarizes essential risk metrics:
Stop-loss value.
Distance from entry in percentage.
Position size (maximum suggested).
Take-profit price.
Customizable:
Adjust parameters like ATR length, smoothing type, risk percentage, transaction fees,
and take-profit percentage.
Modify the visual length of lines representing stop-loss and take-profit levels.
How It Works:
Stop-Loss Calculation:
The stop-loss level is calculated using ATR and a volatility factor (default: 2).
This ensures your stop-loss adapts to market conditions.
Take-Profit Calculation:
Take-profit is derived as a percentage increase from the entry price.
Position Size:
The optimal position size is computed as:
Position Size = Risk per Trade /ATR-based Stop Distance
The risk per trade deducts transaction fees to provide a more accurate calculation.
Visual Lines:
Risk Table:
The table displays updated stop-loss, position size, and take-profit metrics at a glance.
Settings Panel:
Length: ATR length for calculating market volatility.
Smoothing: Choose RMA, SMA, EMA, or WMA for ATR smoothing.
Trade Amount: The capital allocated to a single trade.
Risk by Trade (%): Define how much of your trade capital is at risk per trade.
Transaction Fees: Input fees to ensure realistic calculations.
Take Profit (%): Specify your desired take-profit percentage.
Show Entry Stop Loss: Toggle visibility of the stop-loss line.
Show Entry Take Profit: Toggle visibility of the take-profit line.

Pivot High/Low [s3]This is a technical analysis tool that identifies significant price pivot points (highs and lows) in the market. It looks for both major and minor pivot points, which can help traders identify potential support and resistance levels, trend reversals, and breakout opportunities.
How Pivot Points Are Calculated:
The indicator uses a straightforward "higher than everything around it" or "lower than everything around it" approach:
For Pivot Highs:
- The indicator looks at a specific bar and compares it to bars before and after it
- For a major pivot high: It checks 50 bars to the left and 20 bars to the right
- If the bar's high price is higher than ALL bars within this range, it's marked as a pivot high
- Think of it like a mountain peak - it needs to be the highest point compared to everything around it
For Pivot Lows:
- Same concept but reversed - looking for valleys instead of peaks
- Checks the same ranges (50 left, 20 right)
- The bar's low price must be lower than ALL surrounding bars
- Like finding the bottom of a valley - it needs to be the lowest point in the area
Key Features:
1. Two types of pivot points:
- Major pivots (using longer lookback periods of 50 bars left, 20 bars right)
- Minor pivots (using half the lookback periods - 25 left, 10 right)
2. Visual elements:
- Triangle markers above/below bars for pivot points
- Dotted lines extending from pivot points
- Color coding: Green for lows (support), Red for highs (resistance)
- Major pivots are more prominent than minor pivots
3. Customizable alerts for:
- Formation of new pivot points
- Breakouts above/below pivot levels
Trading Applications:
1. Support and Resistance:
- Major pivot levels act as strong support (lows) and resistance (highs)
- Multiple touches of these levels increase their significance
- Minor pivots can indicate intermediate support/resistance levels
2. Trend Analysis:
- Higher highs and higher lows = Uptrend
- Lower highs and lower lows = Downtrend
- Breaking of major pivot levels can signal trend changes
3. Entry/Exit Signals:
- Long entries: When price bounces off major pivot lows
- Short entries: When price rejects from major pivot highs
- Take profits: At opposite pivot levels
- Stop losses: Just beyond the entry pivot level
4. Breakout Trading:
- Breaking above major pivot highs suggests bullish momentum
- Breaking below major pivot lows suggests bearish momentum
- Use the alert system to catch breakouts early
Settings Customization:
- Adjust lookback periods based on your timeframe
- Toggle visibility of markers and lines
- Customize colors for better visibility
- Enable/disable specific types of alerts
Risk Management Tips:
1. Don't rely solely on pivot points - combine with other indicators
2. Wait for confirmation of bounces/rejections before entering trades
3. Use proper position sizing based on stop loss placement
4. Consider market context and overall trend when trading pivot levels
This indicator is particularly useful for swing traders and position traders who focus on key market turning points and trend changes. It helps identify significant price levels where the market has previously shown reaction, making it valuable for both trend following and counter-trend strategies.

Long Position with 1:3 Risk Reward and 20EMA CrossoverThe provided Pine Script code implements a strategy to identify long entry signals based on a 20-EMA crossover on a 5-minute timeframe. Once a buy signal is triggered, it calculates and plots the following:
Entry Price: The price at which the buy signal is generated.
Stop Loss: The low of the previous candle, acting as a risk management tool.
Take Profit: The price level calculated based on a 1:3 risk-reward ratio.
Key Points:
Buy Signal: A buy signal is generated when the current 5-minute candle closes above the 20-EMA.
Risk Management: The stop-loss is set below the entry candle to limit potential losses.
Profit Target: The take-profit is calculated based on a 1:3 risk-reward ratio, aiming for a potential profit three times the size of the risk.
Visualization: The script plots the entry price, stop-loss, and take-profit levels on the chart for visual clarity.
Remember:
Backtesting: It's crucial to backtest this strategy on historical data to evaluate its performance and optimize parameters.
Risk Management: Always use appropriate risk management techniques, such as stop-loss orders and position sizing, to protect your capital.
Market Conditions: Market conditions can change, and strategies that worked in the past may not perform as well in the future. Continuously monitor and adapt your strategy.
By understanding the core components of this script and applying sound risk management principles, you can effectively use it to identify potential long entry opportunities in the market.

InspireHER Dynamic EMA RR Positioning IndicatorDynamic EMA and RR Positioning Indicator
This indicator is designed to provide traders with highly customizable buy and sell signals based on EMA (Exponential Moving Average) crossovers and Risk-to-Reward (RR) ratios. It works on any timeframe and allows users to toggle price data and additional position boxes for visualizing trade setups. Additionally, traders can choose between displaying dots or labeled signals for buy/sell indicators, making this tool versatile and user-friendly for different preferences and strategies.
What Makes This Indicator Unique
Customizable Parameters: The script offers extensive options for tailoring the indicator to your preferred trading style and strategy:
EMA: Configurable through settings (default is a 21-period EMA).
Risk-to-Reward Ratio (RR): Adjustable to meet your desired RR levels (default is 1:2.5).
Lookback Period: Visualizes buy/sell signals over the last six months.
Position Boxes for Trade Visualization: The indicator can "draw" position boxes on the chart, showing potential entry points, stop-loss (SL), and take-profit (TP) levels based on the selected RR. These visual aids simplify decision-making and help evaluate trade opportunities directly on the chart.
Price Data Toggle: Traders can choose to view or hide price data related to trade signals, including TP, SL, and RR values. By default, this is turned off to maintain a clean chart but can be activated when needed.
Flexible Signal Display Options:
Dots Mode: Displays buy signals as green dots and sell signals as red dots on the chart.
Label Mode: Displays buy signals as labels with the word "Buy" in green and sell signals as labels with the word "Sell" in red.
This toggle allows traders to customize how signals are displayed for a more personalized trading experience.
Simple Signal View: A toggle option provides a cleaner chart by enabling or disabling additional visual elements like circles or labels.
How It Works
Buy Signal: Triggered when the price crosses the EMA and closes above it.
Entry: Top of the candle.
Stop-Loss: Bottom of the candle.
Take-Profit: Calculated based on the selected RR.
Sell Signal: Triggered when the price crosses the EMA and closes below it.
Entry: Bottom of the candle.
Stop-Loss: Top of the candle.
Take-Profit: Calculated based on the selected RR.
Default Settings
EMA: 21-period.
Risk-to-Reward Ratio: 1:2.5.
Price Data: Off (can be toggled on in settings).
Position Boxes: Off (can be toggled on in settings).
Signal Display: Labels mode with "Buy" (green) and "Sell" (red) enabled by default; can be toggled to Dots mode.
Timeframe: Any timeframe supported.
How to Use
Add the Indicator to Your Chart: Once applied, the EMA line and buy/sell signals will appear by default.
Customize Settings: Navigate to the indicator's settings to adjust EMA, RR, or enable/disable Price Data, Position Boxes, or switch between Dots and Label modes.
Trade with Confidence: Use the visual aids and signals to assess trade opportunities based on your strategy and timeframe.
This indicator combines the reliability of EMA-based signals with the flexibility of configurable RR, visual trade setups, and multiple signal display options, making it a powerful tool for all types of traders. Happy Trading!!

Volatility-Driven Trend Reversal (VTR) IndicatorThe Volatility-Driven Trend Reversal (VTR) Indicator is a sophisticated Pine Script trading tool designed to provide clear, non-repainting buy and sell signals based on a combination of trend-following, volatility-based, and momentum analysis. It utilizes Exponential Moving Average (EMA) for trend direction, Average True Range (ATR) for dynamic volatility bands, and Relative Strength Index (RSI) for momentum filtering. The VTR Indicator is built to operate effectively on all market pairs, including cryptocurrency, stocks, and forex, providing traders with reliable, actionable signals for both trend continuation and reversal strategies.
This indicator is tailored to reduce noise and avoid over-signaling by filtering out minor fluctuations. With its unique volatility-based ATR bands, the VTR Indicator excels in volatile environments, such as cryptocurrency markets, and helps traders capture significant price movements while managing risk effectively.
Key Features
Trend Confirmation (EMA):
The indicator relies on the 50-period Exponential Moving Average (EMA) to define the market's primary trend direction. A rising EMA suggests an uptrend, while a falling EMA indicates a downtrend.
Volatility-Based ATR Bands:
ATR (Average True Range) is used to calculate dynamic support and resistance levels based on market volatility. The upper and lower bands represent potential overbought and oversold zones, ensuring that price action aligns with the overall market volatility.
These bands are adaptive to price fluctuations, making them a powerful tool for detecting volatility shifts in real-time.
Momentum Filter (RSI):
The 14-period Relative Strength Index (RSI) is applied to ensure that buy signals only appear when the market is showing upward momentum (RSI above 50) and sell signals when there is downward momentum (RSI below 50).
This filtering mechanism helps avoid false signals during periods of consolidation or ranging markets, improving the signal's overall accuracy.
Non-Repainting Logic:
The buy and sell signals generated by the VTR Indicator are persistent and will not repaint after the bar closes. Once a signal is confirmed, it stays active until an opposite condition triggers a new signal.
This is achieved using a persistent signalState variable, which tracks the current market trend and prevents premature or false signals.
Stop-Loss and Take-Profit Levels:
The indicator automatically generates Stop Loss (SL) and Take Profit (TP) levels based on the ATR multiplier to assist with trade risk management.
These levels are dynamically calculated as a multiple of the ATR value, helping traders manage potential volatility and exit at strategic points.
Multi-Market Compatibility:
The VTR Indicator is suitable for all market pairs (cryptocurrencies, stocks, forex, indices), allowing traders to apply it across various timeframes and asset classes without losing performance reliability.
Alert System:
Built-in alert conditions notify traders of Buy and Sell signals, ensuring they don’t miss any potential trading opportunities.
Signal Logic & Interpretation
Buy Signal (Long Entry):
Condition 1: The price closes above the upper ATR band, suggesting potential upward price movement.
Condition 2: The RSI is above 50, confirming bullish momentum.
Buy Signal Confirmation: The buy signal is generated when both conditions are met and there is no prior active buy signal.
Sell Signal (Short Entry):
Condition 1: The price closes below the lower ATR band, suggesting potential downward price movement.
Condition 2: The RSI is below 50, confirming bearish momentum.
Sell Signal Confirmation: The sell signal is generated when both conditions are met and there is no prior active sell signal.
No Repainting:
Once a buy or sell signal is confirmed, it will not be altered, erased, or replaced by future bars. This ensures that the trader can trust the signal once it appears, knowing it will not change as the market moves.
Exit Points:
Take Profit: When a long position is active, the TP level is calculated as a multiple of the ATR above the entry price.
Stop Loss: When a long position is active, the SL level is calculated as a multiple of the ATR below the entry price.
For short positions, these levels are reversed: TP is below the entry price, and SL is above the entry price.
Trading Strategy:
Entry:
Enter a long position when the buy signal is generated, confirmed by the price crossing the upper ATR band and the RSI being above 50.
Enter a short position when the sell signal is generated, confirmed by the price crossing the lower ATR band and the RSI being below 50.
Exit:
For long positions, exit when the price reaches the Take Profit (TP) level or hits the Stop Loss (SL) level.
For short positions, exit when the price reaches the Take Profit (TP) level or hits the Stop Loss (SL) level.
Risk Management:
Use the ATR-based Stop Loss (SL) and Take Profit (TP) levels to manage risk dynamically.
Always ensure your stop-loss levels are within your risk tolerance for each trade.
Unique Aspects:
Adaptability: The VTR Indicator adapts to changing market conditions, making it suitable for high volatility environments like cryptocurrency trading.
Non-Repainting: Once a signal is generated, it remains valid and doesn't change with new bars, ensuring a reliable trading strategy.
Built-in Risk Management: Automatic dynamic SL and TP levels allow for strategic trade exits, enhancing trade management.
Example Scenario
Scenario 1 (Bullish Trend):
The price is above the upper ATR band, and the RSI is above 50, signaling a strong bullish trend. The buy signal is triggered, and the price continues to rise, hitting the take-profit target based on ATR levels.
Exit: The price reaches the TP level or hits the SL level, and the position is closed.
Scenario 2 (Bearish Trend):
The price is below the lower ATR band, and the RSI is below 50, signaling a strong bearish trend. A sell signal is generated, and the price continues to decline, hitting the take-profit target.
Exit: The price reaches the TP level or hits the SL level, and the short position is closed.

Adaptive Linear Regression ChannelOverview
The Adaptive Linear Regression Channel Script is an advanced, multi-functional trading tool crafted to help traders pinpoint market trends, identify potential reversals, assess volatility, and establish dynamic levels for profit-taking and position exits. By incorporating key concepts such as linear regression , standard deviation , and other volatility measures like the ATR , the script offers a comprehensive view of market behavior beyond traditional deviation metrics.
This dynamic model continuously adapts to changing market conditions, adjusting in real-time to provide clear visualizations of trends, channels, and volatility levels. This adaptability makes the script invaluable for both trend-following and counter-trend strategies, giving traders the flexibility to respond effectively to different market environments.
Background
What is Linear Regression?
Definition : Linear regression is a statistical technique used to model the relationship between a dependent variable (target) and one or more independent variables (predictors).
In its simplest form (simple linear regression), the relationship between two variables is represented by a straight line (the regression line).
y = mx + b
where :
- y is the target variable (price)
- m is the slope
- x is the independent variable (time)
- b is the intercept
Slope of the Regression Line
Definition: The slope (m) measures the rate at which the dependent variable (y) changes as the independent variable (x) changes.
Interpretation:
- A positive slope indicates an uptrend.
- A negative slope indicates a downtrend.
Uses in Trading:
- Identifying the strength and direction of market trends.
- Assessing the momentum of price movements.
R-squared (Coefficient of Determination)
Definition: A measure of how well the regression line fits the data, ranging from 0 to 1.
Calculation :
R2 = 1− (SS tot/SS res)
where:
- SSres is the sum of squared residuals.
- SStot is the total sum of squares.
Interpretation:
- Higher R2 indicates a better fit, meaning the model explains a larger proportion of the variance in the data.
Uses in Trading:
- Higher R-squared values give traders confidence in trend-based signals.
- Low R-squared values may suggest that the market is more random or volatile.
Standard Deviation
Definition: Standard Deviation quantifies the dispersion of data points in a dataset relative to the mean. A low standard deviation indicates that data points tend to be close to the mean, while a high standard deviation indicates that the data points are spread out over a larger range of values.
Calculation
σ=√∑(xi−μ)2/N
Where
- σ is the standard deviation.
- ∑ is the summation symbol, indicating that the expression that follows should be summed over all data points.
- xi, this represents the i-th data point in the dataset.
- μ\mu, this represents the mean(average) of all the data points in the dataset.
- (xi−μ)2, this is the squared difference between each data point and the mean.
- N is the total number of data points in the dataset.
- **Interpretation**
- A higher standard deviation indicates greater volatility.
- Useful for identifying overbought/oversold conditions in markets.
Key Features
Dynamic Linear Regression Channels:
The script automatically generates adaptive regression channels that expand or contract based on the current market volatility. This real-time adjustment ensures that traders are always working with the most relevant data, making it easier to spot key support and resistance levels.
The channel width itself serves as an indicator of market volatility, expanding during periods of heightened uncertainty and contracting during more stable phases. Additionally, the channel width is trained on previous channel widths , allowing the script to adapt and provide a more accurate view of volatility trends of the asset. Traders can also customize the script to train on less historical data , enabling a more recent view of volatility , which is particularly useful in fast-moving or changing markets.
Dynamic Profits and Stops:
What is it?
Dynamic profit levels allow traders to adjust take-profit targets based on real-time market conditions. Unlike static levels, which remain fixed regardless of market changes, these adaptive levels leverage past volatility data to create more flexible profit-taking strategies.
How does it work?
The script determines these levels using previously stored deviation values. These deviations are categorized into quantiles (like Q1, Q2, Q3, etc.) to classify current market conditions. As new deviation data is recorded, the profit levels are adjusted dynamically to reflect changes in market volatility. This approach helps to refine profit targets, especially when using regression channels with standard deviation rather than traditional ATR bands.
Why is it valuable?
By utilizing adaptive profit levels, traders can optimize their exits based on the current volatility landscape. For instance, when volatility increases, the dynamic levels expand, allowing trades to capture larger price movements. Conversely, during low volatility, profit targets tighten to lock in gains sooner, reducing exposure to market reversals. This flexibility is especially beneficial when combined with adaptive regression channels that respond to changes in standard deviation.
Slope-Based Trend Analysis:
One of the core elements of this script is the slope of the regression line , which helps define the direction and strength of the trend. Positive slopes indicate bullish momentum, while negative slopes suggest bearish conditions. The slope's steepness gives traders insight into the market's momentum, allowing them to adjust their strategies based on the strength of the trend.
Additionally, the script uses the slope to create a color gradient , which visually represents the intensity of the market's momentum. The gradient peaks at one color to show the maximum bullish momentum experienced in the past, while another color represents the maximum bearish momentum experienced in the past. This color-coded visualization makes it easier for traders to quickly assess the market's strength and direction at a glance.
Volatility Heatmap:
The integrated heatmap provides an intuitive, color-coded visualization of market volatility. The heatmap highlights areas where price action is expanding or contracting, giving traders a clear view of where volatility is rising or falling. By mapping out deviations from the regression line, the heatmap makes it easier to spot periods of high volatility that could lead to major market moves or potential reversals.
Deviation Concepts:
The script tracks price deviations from the regression line when a new range is formed, providing valuable insights when the price significantly deviates from the expected trend. These deviations are key in identifying potential breakout points or trend shifts .
This helps traders understand when the market is overextended or when a pullback may be imminent, allowing them to make more informed trading decisions.
Adaptive Model Properties:
Unlike static indicators, this script adapts over time . As the market changes, it stores historical data related to channel widths , slope dynamics , and volatility levels , adjusting its analysis accordingly to stay relevant to current market conditions.
Traders have the ability to train the model on all available data or specify a set number of bars to focus on more recent market activity. This flexibility allows for more tailored analysis , ensuring that traders can work with data that best fits their trading style and time horizon.
This continuous learning approach ensures that traders always have the most up-to-date insight into the market's structure.
Table
The table displays key metrics in real time to provide deeper insights into market behavior:
1. Deviation & Slope : Shows the current deviation if set to standard deviation or atr if set to atr(values used to calculated the channel widths) and the trend slope, helping to gauge market volatility and trend direction.
2. Rate of Change : For both deviation/atr and slope, the table also calculates the rate of change of their rates—essentially capturing the acceleration or deceleration of trends and volatility. This helps identify shifts in market momentum early.
3. R-squared : Indicates the strength and reliability of the trend fit. A higher value means the regression line better explains the price movements.
4. Quantiles : Uses historical deviation data to categorize current market conditions into quartiles (e.g., Q1, Q2, Q3). This helps classify the market's current volatility level, allowing traders to adjust strategies dynamically.
By combining these metrics, the table offers a comprehensive, real-time snapshot of market conditions, enabling more informed and adaptive trading decisions.
Settings
Here’s a breakdown of the script's settings for easy reference:
Linear Regression Settings
Show Dynamic Levels :Toggle to display dynamic profit levels on the chart.
Deviation Type :Select the method for calculating deviation—options include ATR (Average True Range) or Standard Deviation.
Timeframe :Sets the specific timeframe for the regression analysis (default is the chart’s timeframe).
Period :Defines the number of bars used for calculating the regression line (e.g., 50 bars).
Deviation Multiplier :Multiplier used to adjust the width of the deviation channel around the regression line.
Rate of Change :Sets the period for calculating the rate of change of the slope (used for momentum analysis).
Max Bars Back :Limits the number of historical bars to analyze (0 means all available data).
Slope Lookback :Number of bars used to calculate the slope gradient for trend detection.
Slope Gradient Display :Toggle to enable gradient coloring based on slope direction.
Slope Gradient Colors :Set colors for positive and negative slopes, respectively.
Slope Fill :Adjusts the transparency of the slope gradient fill.
Volatility Gradient Display :Toggle to enable gradient coloring based on volatility levels.
Volatility Gradient Colors :Set colors for low and high volatility, respectively.
Volatility Fill :Adjusts the transparency of the volatility gradient fill.
Table Settings
Show Table :Toggle to display the metrics table on the chart.
Table Position :Choose where to position the table (e.g., top-right, middle-center, etc.).
Font Size :Set the size of the text in the table. Options include Tiny, Small, Normal, Large, and Huge.

Economic Seasons [Daveatt]Ever wondered what season your economy is in?
Just like Mother Nature has her four seasons, the economy cycles through its own seasons! This indicator helps you visualize where we are in the economic cycle by tracking two key metrics:
📊 What We're Tracking:
1. Interest Rates (USIRYY) - The yearly change in interest rates
2. Inflation Rate (USINTR) - The rate at which prices are rising
The magic happens when we normalize these values (fancy math that makes the numbers play nice together) and compare them to their recent averages. We use a lookback period to calculate the standard deviation and determine if we're seeing higher or lower than normal readings.
🔄 The Four Economic Seasons & Investment Strategy:
1. 🌸 Goldilocks (↑Growth, ↓Inflation)
"Not too hot, not too cold" - The economy is growing steadily without overheating.
BEST TIME TO: Buy growth stocks, technology, consumer discretionary
WHY: Companies can grow earnings in this ideal environment of low rates and stable prices
2. 🌞 Reflation (↑Growth, ↑Inflation)
"Party time... but watch your wallet!" - The economy is heating up.
BEST TIME TO: Buy commodities, banking stocks, real estate
WHY: These sectors thrive when inflation rises alongside growth
3. 🌡️ Inflation (↓Growth, ↑Inflation)
"Ouch, my purchasing power!" - Growth slows while prices keep rising.
BEST TIME TO: Rotate into value stocks, consumer staples, healthcare
WHY: These defensive sectors maintain pricing power during inflationary periods
4. ❄️ Deflation (↓Growth, ↓Inflation)
"Winter is here" - Both growth and inflation are falling.
BEST TIME TO: Focus on quality bonds, cash positions, and dividend aristocrats
WHY: Capital preservation becomes key; high-quality fixed income provides safety
🎯 Strategic Trading Points:
- BUY AGGRESSIVELY: During late Deflation/early Goldilocks (the spring thaw)
- HOLD & ACCUMULATE: Throughout Goldilocks and early Reflation
- START TAKING PROFITS: During late Reflation/early Inflation
- DEFENSIVE POSITIONING: Throughout Inflation and Deflation
⚠️ Warning Signs to Watch:
- Goldilocks → Reflation: Time to reduce growth stock exposure
- Reflation → Inflation: Begin rotating into defensive sectors
- Inflation → Deflation: Quality becomes crucial
- Deflation → Goldilocks: Start building new positions
The blue dot shows you where we are right now in this cycle.
The red arrows in the middle remind us that this is a continuous cycle - one season flows into the next, just like in nature!
💡 Pro Tip: The transitions between seasons often provide the best opportunities - but also the highest risks. Use additional indicators and fundamental analysis to confirm these shifts.
Remember: Just like you wouldn't wear a winter coat in summer, you shouldn't use a Goldilocks strategy during Inflation! Time your trades with the seasons. 🎯
Happy Trading! 📈
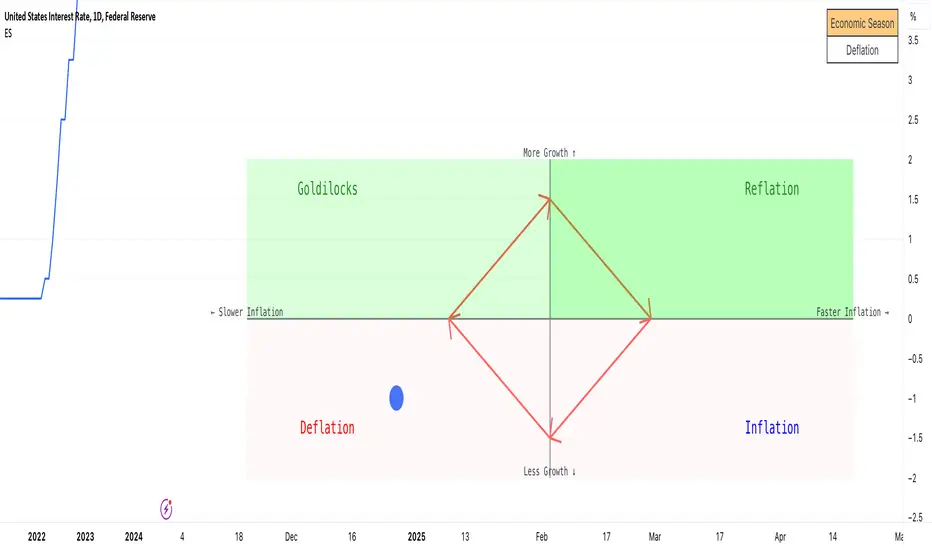
The Pattern-Synced Moving Average System (PSMA)Description:
The Pattern-Synced Moving Average System (PSMA) is a comprehensive trading indicator that combines the reliability of moving averages with automated candlestick pattern detection, real-time alerts, and dynamic risk management to enhance both trend-following and reversal strategies. The PSMA system integrates key elements of trend analysis and pattern recognition to provide users with configurable entry, stop-loss, and take-profit levels. It is designed for all levels of traders who seek to trade in alignment with market context, using signals from trend direction and established candlestick patterns.
Key Functional Components:
Multi-Type Moving Average:
Provides flexibility with multiple moving average options: SMA, EMA, WMA, and SMMA.
The selected moving average helps users determine market trend direction, with price positions relative to the MA acting as a trend confirmation.
Automatic Candlestick Pattern Detection:
Identifies pivotal patterns, including bullish/bearish engulfing and reversal signals.
Helps traders spot potential market turning points and adjust their strategies accordingly.
Configurable Entry, Stop-Loss, and Take-Profit:
Risk management is customizable through risk/reward ratios and risk tolerance settings.
Entry, stop-loss, and take-profit levels are automatically plotted when patterns appear, facilitating rapid trade decision-making with predefined exit points.
Higher Timeframe Trend Confirmation:
Optional feature to verify trend alignment on a higher timeframe (e.g., checking a daily trend on an intraday chart).
This added filter improves signal reliability by focusing on patterns aligned with the broader market trend.
Real-Time Alerts:
Alerts can be set for key pattern detections, allowing traders to respond promptly without constant chart monitoring.
How to Use PSMA:
Set Moving Average Preferences:
Choose the preferred moving average type and length based on your trading strategy. The MA acts as a foundational trend indicator, with price positions indicating potential uptrends (price above MA) or downtrends (price below MA).
Adjust Risk Management Settings:
Set a Risk/Reward Ratio for defining take-profit levels relative to the entry and stop-loss levels.
Modify the Risk Tolerance Percentage to adjust stop-loss placement, adding flexibility in managing trades based on market volatility.
Activate Higher Timeframe Confirmation (Optional):
Enable higher timeframe trend confirmation to filter out counter-trend trades, ensuring that detected patterns are in sync with the larger market trend.
Review Alerts and Trade Levels:
With PSMA’s real-time alerts, traders receive notifications for detected patterns without having to continuously monitor charts.
Visualized entry, stop-loss, and take-profit lines simplify trade execution by highlighting levels directly on the chart.
Execute Based on Entry and Exit Levels:
The entry line suggests the potential entry price once a bullish or bearish pattern is detected.
The stop-loss line is based on your set risk tolerance, establishing a predefined risk level.
The take-profit line is calculated according to your preferred risk/reward ratio, providing a clear profit target.
Example Strategy:
Ensure price is above or below the selected moving average to confirm trend direction.
Await a PSMA signal for a bullish or bearish pattern.
Review the plotted entry, stop-loss, and take-profit lines, and enter the trade if the setup aligns with your risk/reward criteria.
Activate alerts for continuous monitoring, allowing PSMA to notify you of emerging trade opportunities.
Release Notes:
Line Color and Style Customization: Customizable colors and line styles for entry, stop-loss, and take-profit levels.
Dynamic Trade Tracking: Tracks trade statistics, including total trades, win rate, and average P/L, displayed in the data window for comprehensive trade performance analysis.
Summary: The PSMA indicator is a powerful, user-friendly tool that combines trend detection, pattern recognition, and risk management into a cohesive system for improved trade decision-making. Suitable for stocks, forex, and futures, PSMA offers a unique blend of adaptability and precision, making it valuable for day traders and long-term investors alike. Enjoy this tool as it enhances your ability to execute timely, well-informed trades on TradingView.
GG-ShotOverview:
The GG-Shot indicator is built on analyzing key price levels to identify breakouts in both directions of the market. It tracks range boundaries to identify entry points for long and short positions. This indicator includes additional filters to eliminate false signals and increase accuracy in low-volatility conditions. The primary goal of the indicator is to identify levels whose breakout may signal the start of a new trend.
═════════════════════════════════════════════════
🔹 Key Features:
167 Trading Strategies: GG-Shot is equipped with 167 unique strategies, including two universal strategies suitable for most crypto assets. These strategies are adaptable to various market conditions and are beneficial for traders dealing with a wide range of assets.
Take-Profit Levels (TP1-TP4): The indicator provides four static take-profit levels, calculated based on market volatility and strategy configuration. Additionally, two dynamic take-profit levels are adjusted in real-time.
Long and Short Signals: The indicator generates clear long and short signals, helping traders stay prepared for upcoming market moves.
Advanced, Standard, Classic and Channel Modes:
- Advanced Mode: Adds extra trend lines that act as support and resistance levels, useful for entering, increasing, or closing positions. You can also trade between these levels using price movements within the range.
- Standard Mode: Uses pre-set limit-based take-profit levels specifically tailored for each strategy, ensuring a structured approach to trade exits.
- Classic Mode: In this mode, limit-based take-profit levels are not displayed. Profit is instead taken based on dynamic take-profit levels or support/resistance levels.
- Channel Mode: Transforms indicator into a channel trading mode, generating signals when the price touches the upper or lower boundaries of the channel, good for range-bound markets.
Oscillator Mode:
- Enable: Generates signals in both directions, independent of the primary trend.
- By Trend: Filters signals to only work in the direction of the current trend based on the primary indicator signal.
Filtering: The indicator includes two filtering methods:
- Volume Filter: Automatically adjusts the threshold for volume based on the specific asset, helping to filter out signals in low-volume conditions and ensuring higher-quality trades.
- Flat Market Filter: Reduces the number of signals in low-volatility or flat market conditions, improving overall accuracy during periods of market inactivity.
Support and Resistance Zones: Highlights key support and resistance levels on the chart to help traders identify important entry and exit points.
Real-Time Back-Test Panel: Available in both mobile and desktop versions, with only design differences. Both versions provide real-time performance data such as win rates, profit factor, and success rates for each take-profit level (TP1-TP4), along with detailed accuracy statistics for long and short trades.
🔹 How to Trade with GG-Shot:
When you receive a Long/Short signal from indicator, you have two primary options for entering a position:
Instant Entry: Enter immediately with a single entry if the following conditions are met:
- You observe that the trend is strong.
- There is no divergence on the rebound.
- Indicator signals are consistently pointing in one direction (with priority given to these signals).
- The Risk-to-Reward ratio is normal.
Split Entry or Pullback Entry: Enter in parts or wait for a pullback if the following conditions apply:
- The trend is flat or there is low market volatility.
- There are divergences on the rebound.
- The Risk-to-Reward ratio is negative or the signal appears abnormal.
Once you have entered the position, follow these guidelines for Take Profit and Stop Loss management:
Place limit Take Profit orders as follows:
50% of the position at the 1st take profit level (TP1).
25% at the 2nd take profit level (TP2).
15% at the 3rd take profit level (TP3).
10% at the 4th take profit level (TP4).
After reaching the first Take Profit (TP1), move the Stop Loss on the remaining position to breakeven to protect your capital.
Additional Trade Management with Oscillator Signals:
When TP1 is reached, and a green\red cross (oscillator function) appears against the trend direction, it is recommended to fully close the position. This signal indicates a potential reversal or a significant pause in the trend.
In certain cases, you can also open a small position in the opposite direction. Place your Stop Loss behind the nearest support or resistance level (using the Support and Resistance Zones or the Advanced Mode of GG-Shot). You can start taking profits at the nearest support or resistance levels or trend lines, while leaving part of the position open for further movement if a reversal signal appears. in most cases, price will bounce when there’s a combination of dynamic TP levels and the oscillator cross near important levels.
Re-entry Strategies:
If you see a cross from the trend line in the direction of the signal, you can re-enter the position with a more favorable Risk-to-Reward ratio. Use the nearest support or resistance level or a reverse signal as an entry point. After the price bounces off the Trend Line, move the Stop Loss to breakeven. Often, when the trend line follows the price, the price continues to track the line. This strategy can also be applied in combination with RSI , especially when there are divergences near the trend line.
Key Observations for Signal Strength:
In most cases, the trend line gives an early indication of future price movement. For example, if you receive a short signal , but the Trend Line is going up, the price is likely to touch the trend line before continuing downtrend. In such cases, it’s better to skip the signal or look for an entry from the Trend Line , especially when there are divergences supporting the direction of the signal.
Alternatively, when a short signal is accompanied by a falling trend line, the more it falls, the more significant the potential dump.
═════════════════════════════════════════════════
🔹 How to Use:
Step 1: Add GG-Shot to your TradingView chart.
Step 2: Choose one of the modes:
Advanced, Standard, or Channel, and select a strategy from the 167 available options.
Step 3: Check Long/Short signals for entering positions, using the provided take-profit and stop-loss levels.
Step 4: Use the Back-Test Panel to assess the performance of the chosen strategy and adjust your approach based on real-time data.
Note: All trading involves risk, and past performance is not indicative of future results.
Bitcoin 100 Pips Indicator 5Bitcoin 100 Pips Indicator
Description: The Bitcoin 100 Pips Indicator is a powerful tool designed for traders who seek to capitalize on rapid price movements in the Bitcoin market. This indicator provides clear entry and exit signals based on a combination of price action analysis and pre-defined profit targets.
Key Features:
Quick Entry and Exit Signals: The indicator generates buy and sell signals in real-time, allowing traders to enter and exit positions quickly and effectively.
Targeting 100 Pips: Specifically designed to target 100 pips of profit for each trade, this indicator sets clear take profit and stop loss levels, helping traders manage their risk and reward effectively.
User-Friendly Interface: With easily visible signals and annotations directly on the chart, the indicator enhances your trading experience without cluttering your view.
Adjustable Settings: Traders can customize the pip target and stop loss levels according to their individual strategies, providing flexibility to accommodate different trading styles.
Ideal for Short-Term Trading: Whether you are a scalper or a day trader, this indicator is optimized for M5 and M15 timeframes, making it ideal for capturing quick price movements in the volatile Bitcoin market.
How to Use:
Apply the Bitcoin 100 Pips Indicator to your chart and select your preferred trading timeframe (M5 or M15).
Look for buy signals indicated by green labels when market conditions favor upward movement.
Conversely, watch for sell signals marked by red labels during downward trends.
Use the provided take profit and stop loss levels to manage your trades effectively.
Disclaimer: This indicator is for informational purposes only and does not guarantee profits. Always practice proper risk management and conduct your own analysis before trading.

Ping Pong Bot StrategyOverview:
The Ping Pong Bot Strategy is designed for traders who focus on scalping and short-term opportunities using support and resistance levels. This strategy identifies potential buy entries when the price reaches a key support area and shows bullish momentum (a green bar). It aims to capitalize on small price movements with predefined risk management and take profit levels, making it suitable for active traders looking to maximize quick trades in trending or ranging markets.
How It Works:
Support & Resistance Calculation:
The strategy dynamically identifies support and resistance levels using the lowest and highest price points over a user-defined period. These levels help pinpoint potential price reversal areas, guiding traders on where to enter or exit trades.
Buy Entry Criteria:
A buy signal is triggered when the closing price is at or below the support level, and the bar is green (i.e., the closing price is higher than the opening price). This ensures that entries are made when prices show signs of upward momentum after hitting support.
Risk Management:
For each trade, a stop loss is calculated based on a user-defined risk percentage, helping to protect against significant drawdowns. Additionally, a take profit level is set at a ratio relative to the risk, ensuring a disciplined approach to exit points.
0.5% Take Profit Target:
The strategy also includes a 0.5% quick take profit target, indicated by an orange arrow when reached. This feature helps traders lock in small gains rapidly, making it ideal for volatile market conditions.
Customizable Inputs:
Length: Adjusts the period for calculating support and resistance levels.
Risk-Reward Ratio: Allows traders to set the desired risk-to-reward ratio for each trade.
Risk Percentage: Defines the risk tolerance for stop loss calculations.
Take Profit Target: Enables the customization of the quick take profit target.
Ideal For:
Traders who prefer an active trading style and want to leverage support and resistance levels for precise entries and exits. This strategy is particularly useful in markets that experience frequent price bounces between support and resistance, allowing traders to "ping pong" between these levels for profitable trades.
Note:
This strategy is developed mainly for the 5-minute chart and has not been tested on longer time frames. Users should perform their own testing and adjustments if using it on different time frames.

Session Range Breakouts With Targets [AlgoAlpha]⛓️💥Session Range Breakouts With Targets 🚀
Introducing the "Session Range Breakouts With Targets" indicator by AlgoAlpha, a powerful tool for traders to capitalize on session-based range breakouts and identify precise target zones using ATR-based calculations! Whether you trade the Asian, American, European, or Oceanic sessions, this script highlights key breakout levels and targets that adapt to market volatility, ensuring you're always prepared for those crucial price movements. 🕒📊
Session-based Trading : The indicator highlights session-specific ranges, offering clear breakouts for Asian, American, European, Oceanic, and even custom sessions 🌍.
Adaptive Volatility Zones : Uses ATR to determine dynamic zone widths, filtering out fakeouts and adjusting to market conditions ⚡.
Precise Take-Profit Targets : Set multiple levels of take-profits based on ATR multipliers, ensuring you can manage both aggressive and conservative trades 🎯.
Customizable Appearance : Tailor the look with customizable colors for session highlights and breakout zones to fit your chart style 🎨.
Alerts on Key Events : Built-in alert conditions for breakouts and take-profit hits, so you never miss a trading opportunity 🔔.
🚀 Quick Guide to Using the Indicator
🛠 Add the Indicator : Add the indicator to favorites by pressing the star icon. Choose your session (Asia, America, Europe, Oceana, or Custom) and adjust the ATR length, zone width multiplier, and target multipliers to suit your strategy.
📊 Analyze Breakouts : Watch for the indicator to plot upper and lower range boxes based on session highs and lows. Price breaking through these boxes will signal a potential entry.
📈 Monitor Targets : Track bullish and bearish targets as price moves, with up to three take-profit levels based on ATR multipliers.
🔔 Set Alerts : Enable alerts for session breakouts or when price hits your designated take-profit targets.
🔍 How It Works
This script operates by identifying session-specific ranges based on highs and lows from the beginning of the selected session (Asia, America, Europe, or others). After a user-defined wait period (default: 120 bars), it calculates the highest and lowest points and creates upper and lower zones using the Average True Range (ATR) to adapt to market volatility. If the price breaks above or below these zones, it is identified as a breakout, and the script dynamically calculates up to three take-profit targets for both bullish and bearish scenarios using an ATR multiplier. The indicator also includes alerts for breakouts and take-profit hits, providing real-time trading signals.
